
 Print
Print
|
|
|
Active Faults Panel
The Active Faults panel appears at the bottom of the dashboard screen. It displays faults as they are received by the Controller module. As such, it is a dynamic view, and may change rapidly as events are triggered and cleared.
When the Active Faults list is collapsed, it displays a narrow bar at the bottom of the interface. The bar displays the color of the worst active fault in the frame.
To open the Active Faults list, click the up arrow in the bottom right of the dashboard.
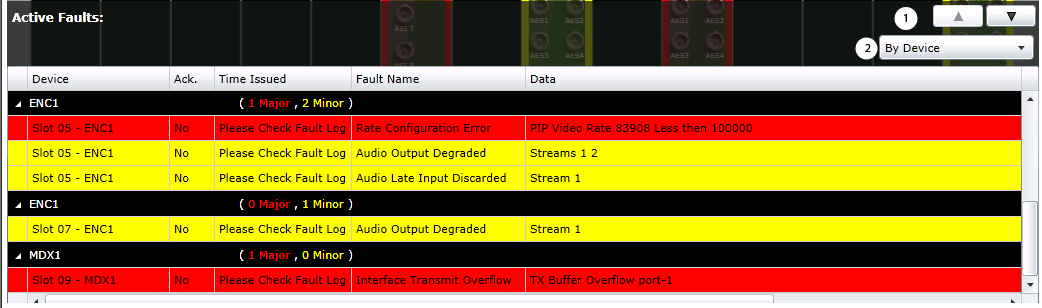
Active Faults Open on Dashboard
If there are more faults than can appear on the page, a scroll bar appears at the right of the list so you can view items that are not currently visible.
Active Faults List Key
Key |
Description |
|---|---|
1 |
Opens (up) or closes (down) the Active Faults panel |
2 |
Toggles All Faults or By Device (which displays all faults grouped by device) |
You can sort the Active Faults List by column headers.
Active Faults List Column Headers
Column Header |
Function |
|---|---|
Device |
The module name (and custom name, if created) of the module that originated the fault |
Ack |
Whether the fault has been acknowledged |
Time Issued |
The point at which the fault was triggered (some conditions must be in an activated state for a period of time before the Fault is triggered) |
Fault Name |
The name of the fault, as defined by the triggering module |
Data |
If necessary, the triggering module uses this field to present more information about the fault; this field can be empty |
Error Level |
Indicates the severity of the fault as Major (6-10) or Minor (1-5) |
Count |
Number of times this fault has been triggered (you can usually clear this count by resetting the module) |
Parameter Configure |
Provides a hyperlink to a specific control associated with correcting the fault. |
To view the history of faults, see Faults and Events .
|
© 2018 Imagine Communications Corp. Proprietary and Confidential |
Return to Top |