
 Print
Print
|
|
|
Connections Diagram
The Connections Diagram shows all defined connections within the frame.
To open the Connections Diagram, click the drop-down menu at the top right of the Dashboard screen (to the left of the Controller Status panel) and select Connections Diagram.
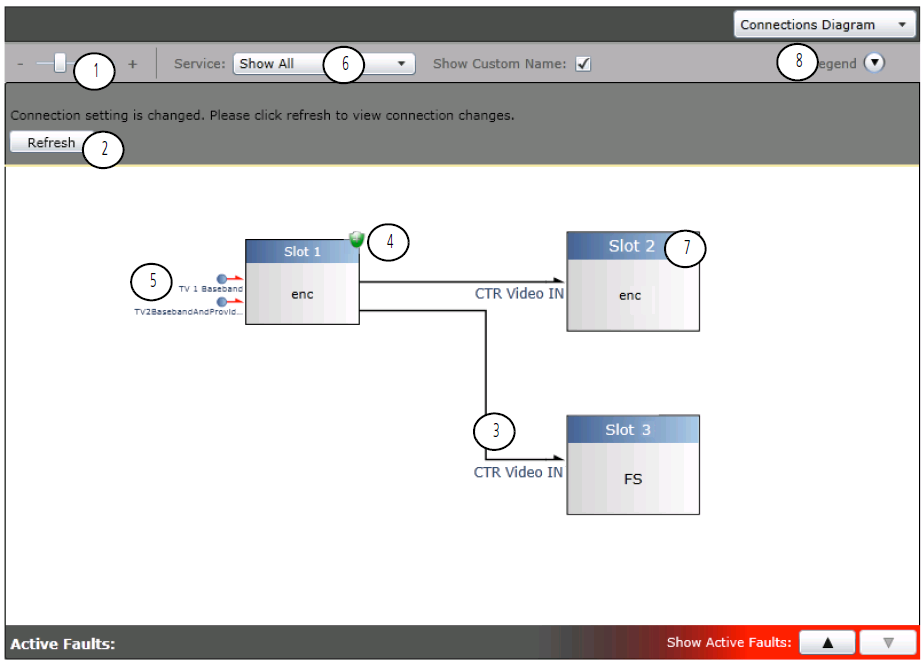
The Connections Diagram is primarily for informational purposes. The elements of a Connections Diagram include the following:
Connections Diagram Key
Key |
Item |
Description |
|---|---|---|
1 |
Zoom in/out slider |
Use the slider, or the wheel on your mouse, to zoom in and out on the Connections Graph, so you can see the overall picture or just a small area. If the graph is too large to view in the window provided for it, use the sliders at the left and/or bottom of the screen to view the correct portion of the graph. |
2 |
Refresh button |
This button only appears if the connections have been altered and the graph is no longer representative of the current flow of signals through the SEL-MCP3 frame. Because the flow is built dynamically based on information provided to the controller module, even a minor change to connections can create a radically different connection diagram. |
3 |
Flow indicator |
Shows the direction and status of a signal within the frame. Roll the mouse over the line to highlight it, and to view an information box that describes that signal. A dashed line indicates a secondary (redundant) connection. See Creating a Redundant Connection . |
4 |
Protection status indicator |
Any slot (functional block) within the frame that is involved in protecting another module, or is being protected by that other module, indicates its protection status here. Statuses are indicated by color. Color meanings are described in Frame View . |
5 |
Input indicator |
|
6 |
Service menu |
The drop-down menu has options to show all services, or to show a single service, as defined in the Connection Manager. See the figure below. |
7 |
Module |
The box size of a module is based on the number of connections it has. |
8 |
Legend |
Click the up arrow to view an explanation of items on the graph, or click the down arrow to close the legend. |
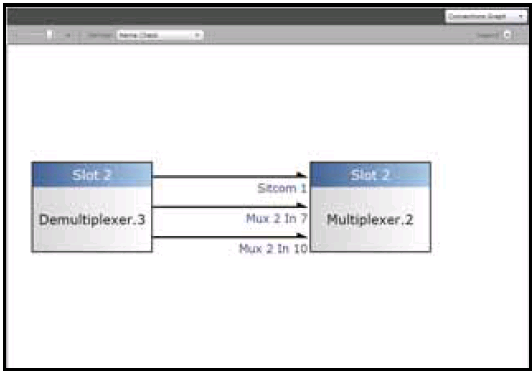
Single Service on the Connections Graph
A service that is shown in dark amber or grey (depending on the theme), indicates that the function has been removed from the configuration.
Connections that are red in the Connections Graph have a major fault. Connections that are yellow have a minor fault.
|
© 2018 Imagine Communications Corp. Proprietary and Confidential |
Return to Top |